There has been much attention in the media this year relating to mail delays and new USPS delivery standards. So, how is the Postal Service doing at meeting their service standards? This is what we’ve seen through the summer for First-Class Letters:
And for Marketing Mail letters:
Huh? Marketing Mail has a better on-time percentage than First-Class Mail?
OK, let’s pause here to talk about what we’re looking at. Since May, SnailWorks has been building a performance database of delivery times from induction to delivery across the nation. To be included in the sample, each piece must have a valid induction scan into the Postal system, and a valid delivery scan. To date that qualifies about 61% of our mail. Far and away, the biggest disqualifier is the lack of an induction scan. Resolving this remains a big USPS challenge – they need to scan all pallets.
That notwithstanding, 61% is a valid sample. We typically track about 10,000,000 pieces of mail a day, and 6,000,000 of them are typically included in the sample. So, these results are based on a lot of mail.
A couple of other things to keep in mind:
- We are tracking commercial mail, presorted and prepared. Our anecdotal experience is that this travels much more reliably than Grandma’s Holiday card.
- We are tracking mail for more than 100 mailers with entry points across the country, but there are a lot of possible induction/delivery pairs, so even with six million a day, we still may not be able to tell you how long it takes to get a letter from Laredo to Dubuque.
- We are forever refining our data and analyses. Right now, confidence is high, but we allow for imperfections in the data. Your mailing may vary. But probably not by much.
- We are using “Postal” days in our tracking. We don’t count Sundays and holidays.
OK, that aside, let’s look at those first two graphs. These graphs represent how many pieces were on-time by USPS published standards. You no doubt noticed that Marketing Mail on-time performance is better than First-Class Mail. This is for a couple of reasons: Marketing Mail has much more generous standards, and a great deal of the Marketing Mail we track is inducted at the delivery SCF. Intra-SCF delivery tends to be pretty good. Because FCM is not generally shipped, it relies on Postal transportation, and its delivery standards are much tighter (for now).
Another trend worth noticing, both classes seem to be trending ever so slightly downward. That last week on the FCM graph may yet darken as mail has more time to be late. We’ll see.
Here are some other trending views;
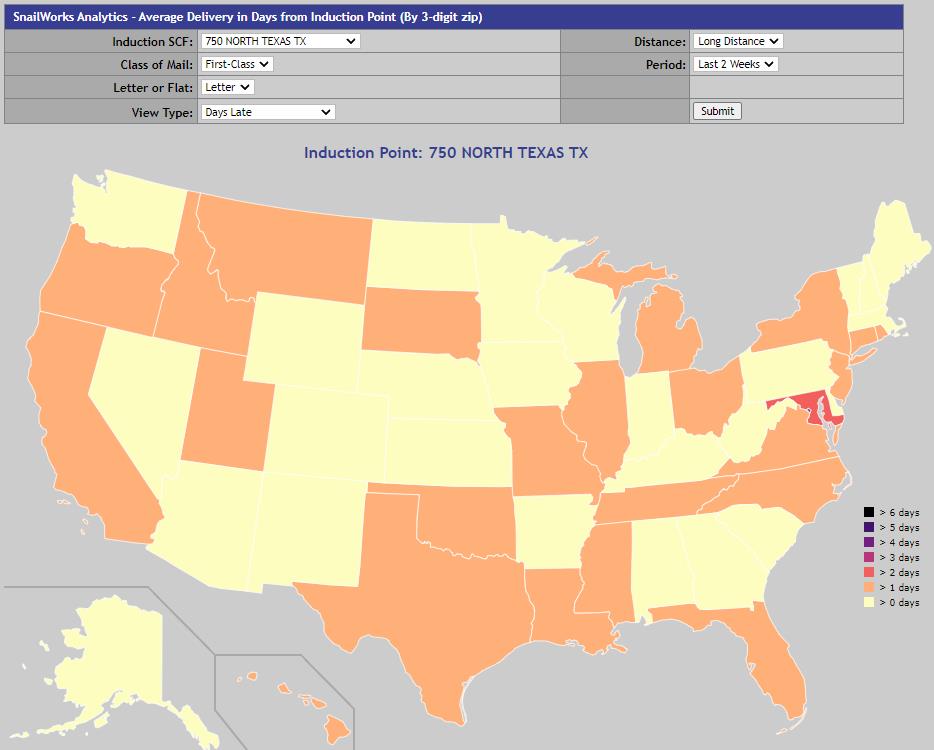
This first map shows on-time and late deliveries for First-Class Letters mailed from North Texas, TX:
This includes all available data back to May 31. The hurricane impacted areas show some delay, as well as Maryland, a frequent trouble spot for the past year.
Now, if we just use data for the last two weeks, it appears things are getting worse:
We’re hesitant to jump to any conclusions here – again we just began working with this data, but this bears watching.
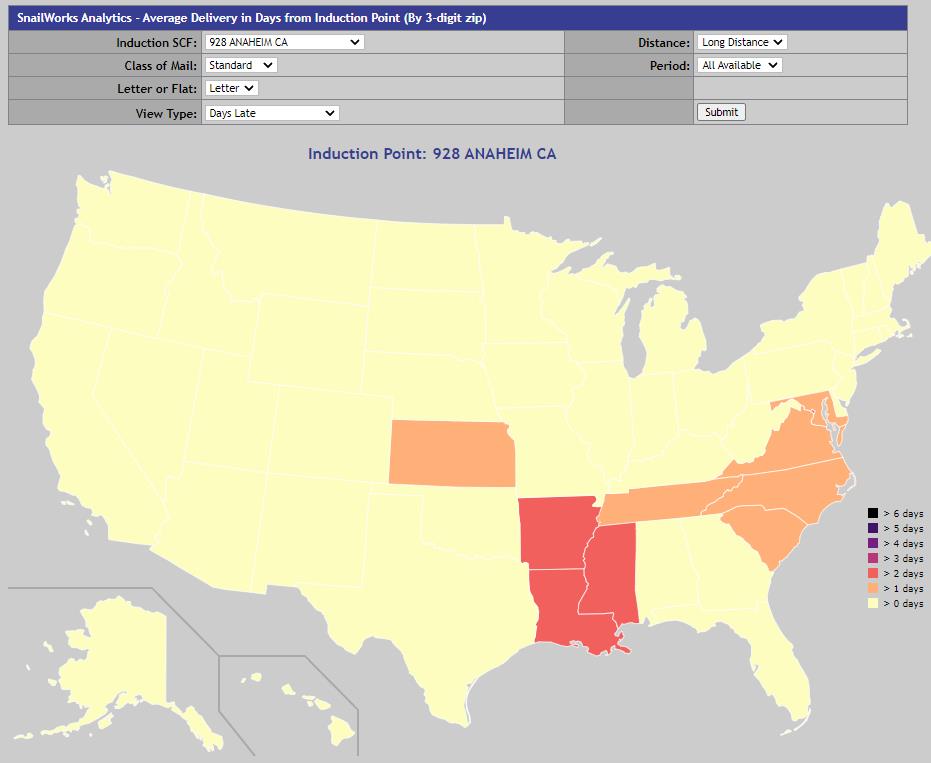
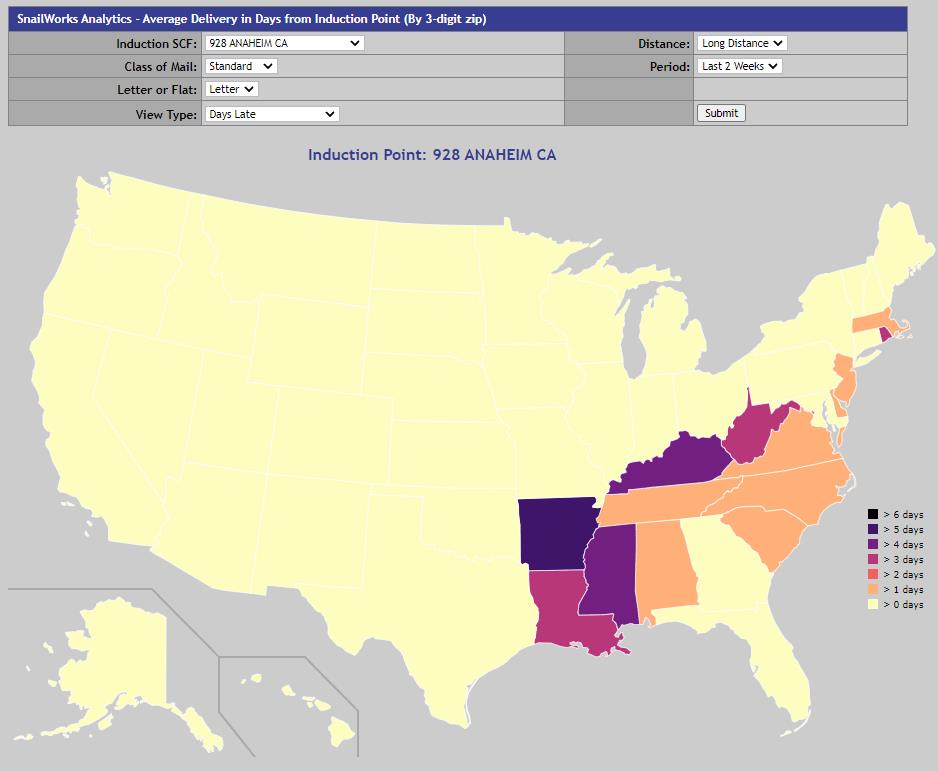
A couple of final views without commentary for Marketing Mail mailed from Anaheim, CA:
The first is days late vs USPS Standards using all data (since May 31):
Same thing using just the last two weeks data:
Stay tuned as we expand our analysis. We expect to be able to give certain clients access to these reports in the coming months. And a lot more.