Ever wanted to create your own US Mail Traffic Report? You now have the tools to do it! Last June, SnailWorks began compiling delivery statistics on the billions of pieces of mail that we track every year. If you follow us on Linked In (you do, don’t you?) you have seen our mail traffic report each Monday. We are now opening analytics reporting to all clients. Best of all, it’s easy to use and powerful.
When you open your SnailWorks account, you will see a new “Analytics” button on the top control bar:
Mouse over it to see three report selections: 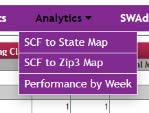
SCF to State Map shows weighted average delivery times from a selected induction SCF to each state as both a map view, and a table below the map. The selection controls to create your view are located above the map:
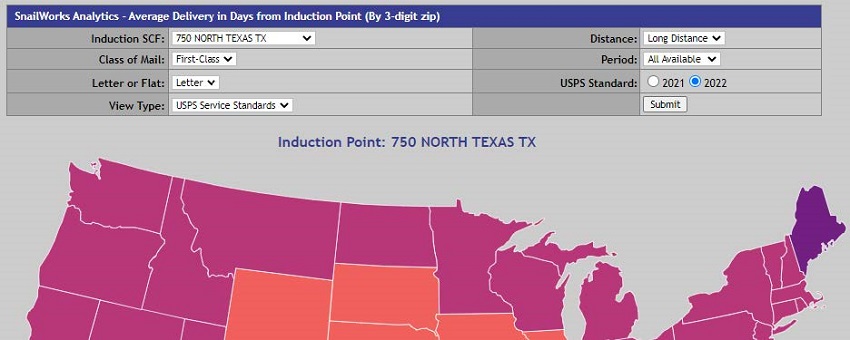
Available selections are:
- Induction SCF: Select the SCF where the mail is being inducted.
- Class of Mail: Choose First-Class or Standard (Marketing Mail).
- Letter or Flat: Choose letters or flats. Cards are included in “letters”
- View type: You have three available views:
- USPS Service Standards: Color-coded each state based on the number of days allowed for on-time mail by USPS service standards.
- Days Actual: Shows how many days, on average, mail is taking to reach that state for the selected class, piece type, and induction SCF.
- Days Late: Shows, on average, number of days late mail is to that state for the selected class, piece type, and induction SCF.
There are also some filters through which to view the results:
- Distance: This filter is not currently in use
- Period: Choose to see results for all pieces in the system, or narrow the view to the last 2, 4, 6, or 8 weeks of data, to identify how service currently is, or may have deteriorated from the average.
- USPS Standards: For First-Class Mail choose to measure lateness against either prior pre-October 1, 2021 standards, or the current standards adopted on October 1, 2021. This only applies to First-Class Mail. Marketing Mail standards have not changed.
SCF to Zip3 Map offers the same views and filters with a much more detailed destination view by SCF:
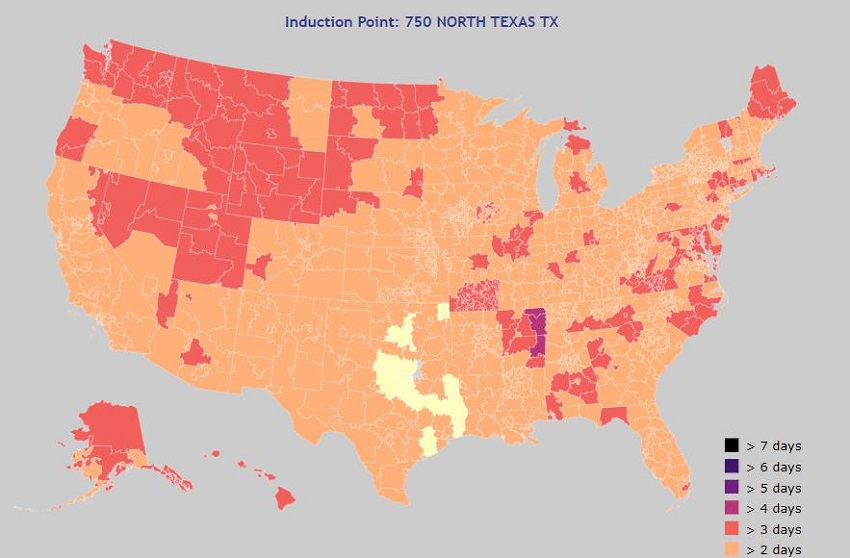
Some points about the data:
- Because this is an aggregate of SnailWorks client data, not every induction point will generate data for every class and size of mail.
- Results are for mail that meets qualification criteria: Full-Service Mail that has a valid “Start the Clock” scan and that is tracked to delivery.
- Results shown are for postal days – Sundays and holidays are excluded.
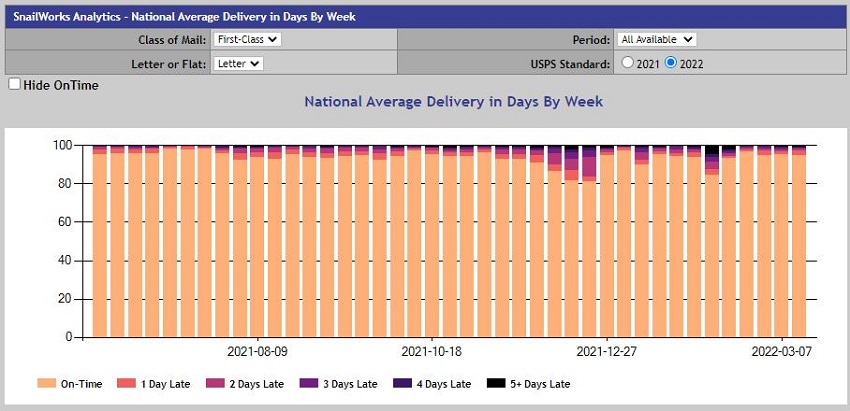
Performance by Week is an overall assessment of on-time delivery percentages by class and piece type. You can choose to view on-time performance by current standards or last year’s standards for First-Class Mail. Standards have not changed for Marketing Mail. Mouse over bars on the graph to see numeric values. Select “Hide On-Time” to see just the late mail and see just how late it was.
What to do with all this data?
Share it with your customers! Make yourself their Postal expert, knowing how the USPS is performing each week. Help them plan drop dates based on how long it takes mail to deliver. Look for trouble spots.
These reports are simple to use and powerful. We have more detailed access to the data and may provide new views in the future. Not sure how to best use it? Contact us – we love helping!